Asia-Pacific now has 41 exhibition venues offering at least 100,000 sqm of indoor space, compared with Europe’s 38, as global exhibition capacity reaches 45.2 million sqm across 1,565 venues.
Asia-Pacific has overtaken Europe in the number of the world’s largest exhibition venues for the first time, according to the 2026 edition of the World Map of Exhibition Venues, published by UFI, The Global Association of the Exhibition Industry, and produced by jwc GmbH.
The report identifies 41 venues with at least 100,000 sqm of gross indoor exhibition space across Asia-Pacific, against 38 in Europe. In the previous edition, the two regions were level, underscoring the continued geographical shift in exhibition infrastructure.
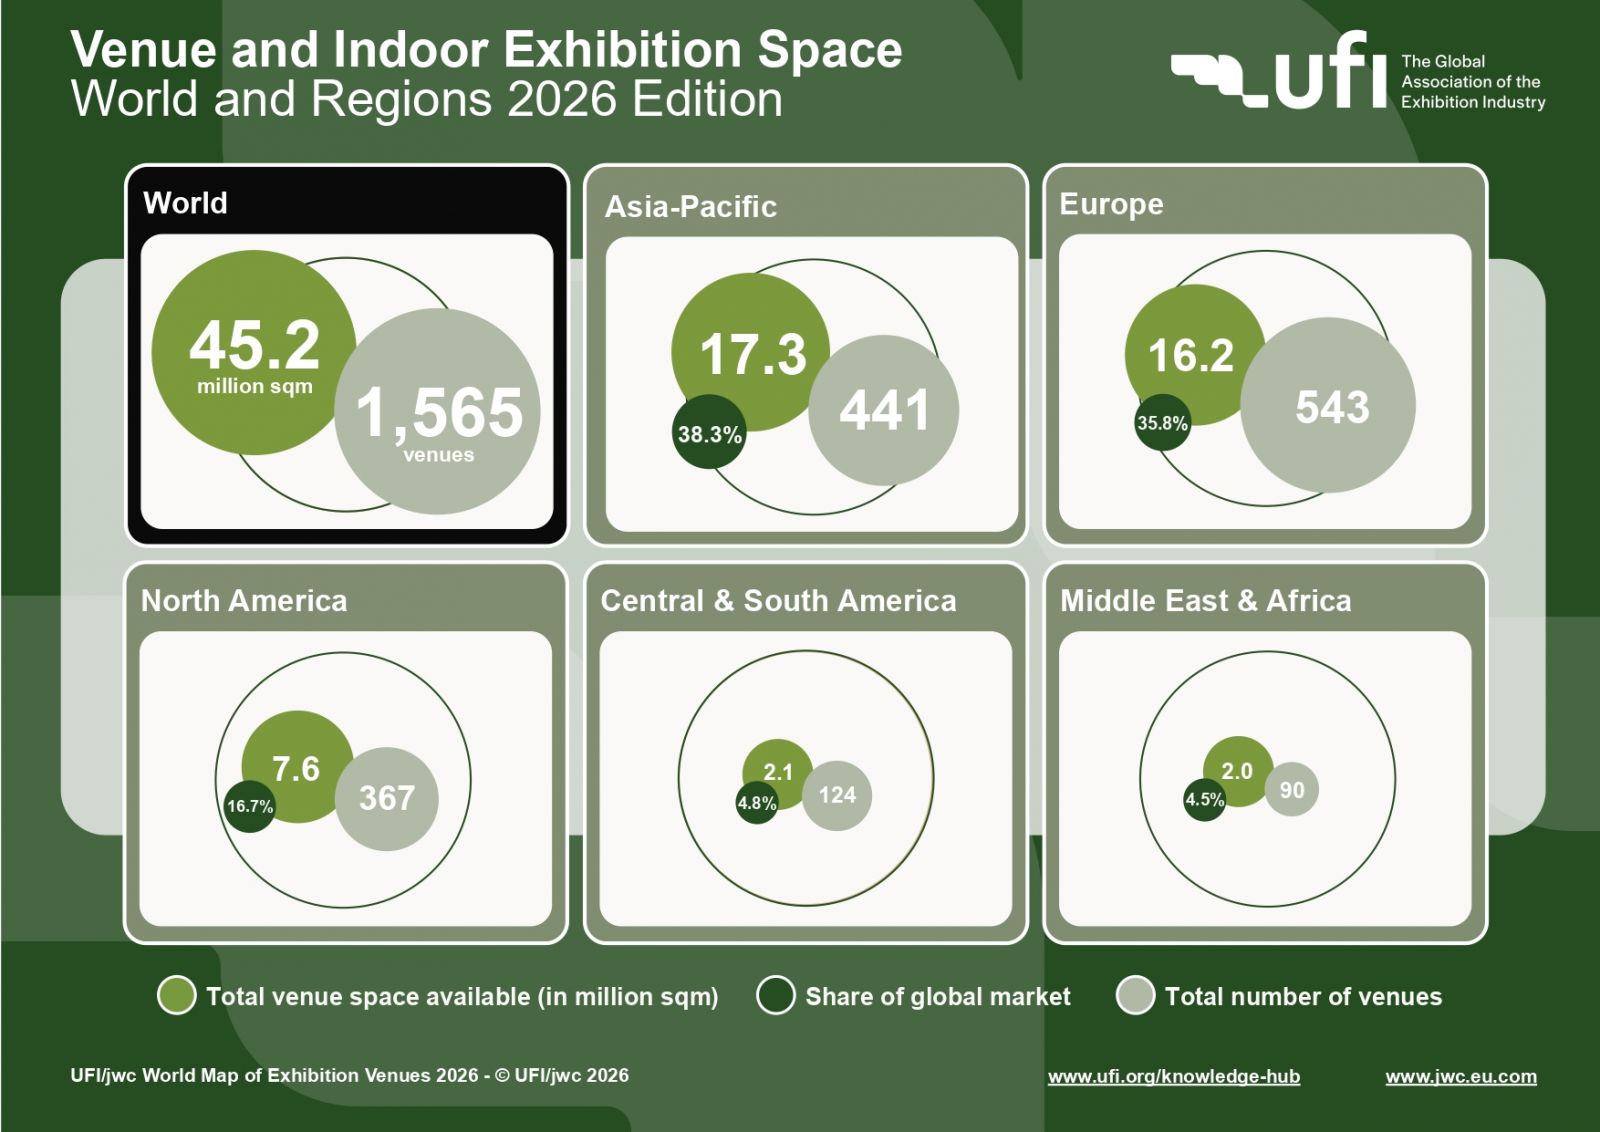
Globally, the study recorded 1,565 venues offering at least 5,000 sqm of indoor exhibition space as of 31 December 2025. Their combined capacity reached 45.2 million sqm, an increase of 35 venues and approximately 900,000 sqm compared with the previous edition.
Asia-Pacific accounts for 38.3% of global exhibition capacity, equivalent to 17.3 million sqm, extending its lead over Europe, which holds 35.8%. North America ranks third, with 16.7% of the worldwide total.
The report also highlights the growing contribution of emerging exhibition markets. Central and South America now account for 4.8% of global indoor exhibition space, while the Middle East and Africa represent 4.5%. Together, the two regions have increased their share from 8.4% to 9.3% in a year.
“Exhibition venues are long-term investments in economic infrastructure,” says Chris Skeith OBE, UFI CEO. He points to the growth in global capacity and Asia-Pacific’s lead in mega venues as evidence of exhibition infrastructure tracking industrial development worldwide. For organisers, he adds, this creates opportunities to expand into markets investing in future capacity.
"This year’s World Map shows venues tracking industrial growth worldwide, with global capacity at 45.2 million sqm and Asia-Pacific ahead of Europe in mega venues for the first time. Central & South America, and the Middle East & Africa are also steadily building their share. For organisers, this means real room to expand into markets positioned for growth, with capacity built for the future."
The scale of exhibition infrastructure varies considerably between regions. Asia-Pacific venues average 39,238 sqm, compared with 29,802 sqm in Europe and 17,327 sqm in Central and South America. The latter remains the only region without a venue offering at least 100,000 sqm.
Despite the prominence of mega venues, smaller facilities continue to dominate the global landscape. Some 62% of venues offer less than 20,000 sqm of indoor space, while 33% fall within the 20,000–99,999 sqm range. Only 5%, representing 84 venues, provide at least 100,000 sqm.
The world’s largest exhibition venue remains the Canton Fair Complex in Guangzhou, China, with 504,000 sqm of indoor exhibition space.
At country level, China accounts for 30.7% of global capacity, followed by the United States at 13.9% and Germany at 7%. Together with Italy and France, these five markets control almost 63% of the world’s indoor exhibition space. Seven countries each offer more than one million sqm.
For Jochen Witt, President and CEO of jwc GmbH, the figures point to a question that extends beyond size alone: how well venues respond to market requirements.
“The headline numbers are about size, but the more important story is fit,” Witt says, arguing that destinations should align venue capacity and quality with the needs of organisers and their markets rather than pursue ever-larger facilities.
"Market requirements are rapidly changing, and venue sizes and qualities need to adapt. Chasing the largest footprint is no longer suitable; successful destinations need to match capacity and quality to meet market requirements. Most of the world’s venues still offer less than 20,000 sqm, which is sufficient for many markets. For cities and governments considering new venue capacities, this data provides the benchmarks to get the sizing decision right. Venue quality is another topic but needs the same extent of focus.”
The 2026 edition provides detailed profiles of 22 countries and regions with more than 300,000 sqm of indoor exhibition space. These include Austria, Belgium, Brazil, Canada, China, France, Germany, India, Italy, Japan, Mexico, the Netherlands, Poland, Russia, Saudi Arabia, South Korea, Spain, Switzerland, Türkiye, the United Arab Emirates, the United Kingdom and the United States. Profiles of all five global regions are also included.
The research was compiled with contributions from national and regional industry associations and partners, including BDO in Portugal, alongside organisations representing markets across Europe, the Americas, Asia-Pacific, the Middle East and Africa.
The full World Map of Exhibition Venues 2026, including its regional and country profiles, is available free of charge through UFI’s Knowledge Hub and jwc GmbH.
Published by Meeting Media Company, the publisher of Headquarters Magazine (HQ) – a leading international publication based in Brussels, serving the global MICE industry and association community.
Since its founding in 1992, Meeting Media Group, publisher of Headquarters Magazine (HQ), has been a trusted guide and voice for associations and the global MICE (Meetings, Incentives, Conferences, and Exhibitions) industry.